NetPath-Agent (Network Path Intelligence)
Overview
NetPath-Agent is an advanced, automated network diagnostic agent designed to dynamically analyze, map, and troubleshoot complex multi-vendor network fabrics.
It provides real-time visibility, connectivity metrics (latency, packet loss), and path tracing across SONiC, Arista EOS, Cisco NX-OS, and Cisco IOS-XE. The agent pairs conversational insights with an interactive graphical dashboard for live visualization.
Key Capabilities
- Automated Topology Mapping: Discovers and maps network topology by scanning connected inventory.
- Fabric Connectivity Heatmap: Conducts any-to-any ping meshes for latency and loss capabilities.
- Hop-by-Hop Remote Traceroute: SSH access to trace paths and identify localized failures.
- Live Streamlit Dashboard: Multi-tab interface to visualize network graphs, heatmaps, and path diagrams.
- Historical Network Analytics: Time-series trends of connectivity performance.
Agent Definition
agent = Agent(
    name="NetPath_Agent",
    description="Automated Network Path Intelligence Agent with Visual Analytics",
    instructions=...
)
NetPath-Agent uses specific tool-based execution (no ad-hoc processing) and automatically adjusts troubleshooting commands based on the target OS platform type within its inventory.
Tools Used
NetPath-Agent is powered by the following tools:
tools = [
    collect_network_data,
    analyze_path_topology,
    list_inventory,
    check_device_health,
    show_database_stats,
    run_ping_mesh,
    run_full_network_scan,
    get_ping_mesh_results,
    get_ping_mesh_history,
    run_remote_traceroute,
]
Tool Responsibilities
| Tool | Purpose |
|---|---|
run_full_network_scan |
Discovers topology by scanning all connected inventory |
run_ping_mesh |
Conducts Any-to-Any ping tests to build connectivity heatmap |
collect_network_data |
Runs ping and traceroute diagnostics on a specific device |
analyze_path_topology |
Analyzes path trace data to find loss and localized failures |
check_device_health |
Verifies ICMP reachability and SSH authentication/accessibility |
run_remote_traceroute |
SSH into a device and runs traceroute to a target |
get_ping_mesh_results |
Fetches raw latest mesh structured latency/loss data |
get_ping_mesh_history |
Retrieves historical latency/loss trends for a device pair |
list_inventory |
Lists all available network devices mapped in the registry |
show_database_stats |
Displays database metrics, recent ping, and trace dumps |
Operating Rules & Constraints
- Platform Neutrality:
The agent automatically switches syntaxes for
pingandtraceroutedepending on the platform (Linux, EOS, NX-OS, IOS). - Automated Failure Detection:
If a multi-vendor topology ping fails to return valid responses, it is automatically marked as
100% lossand flagged. - Persistent Insights:
All network telemetry and diagnostics are preserved locally in SQLite (
/tmp/netpath_data.db) for trend tracking. - Dashboard First: While providing real-time natural language answers, complex correlation and visualization mappings are delegated to the Streamlit Dashboard.
NetPath Workflows
What is the visual goal?
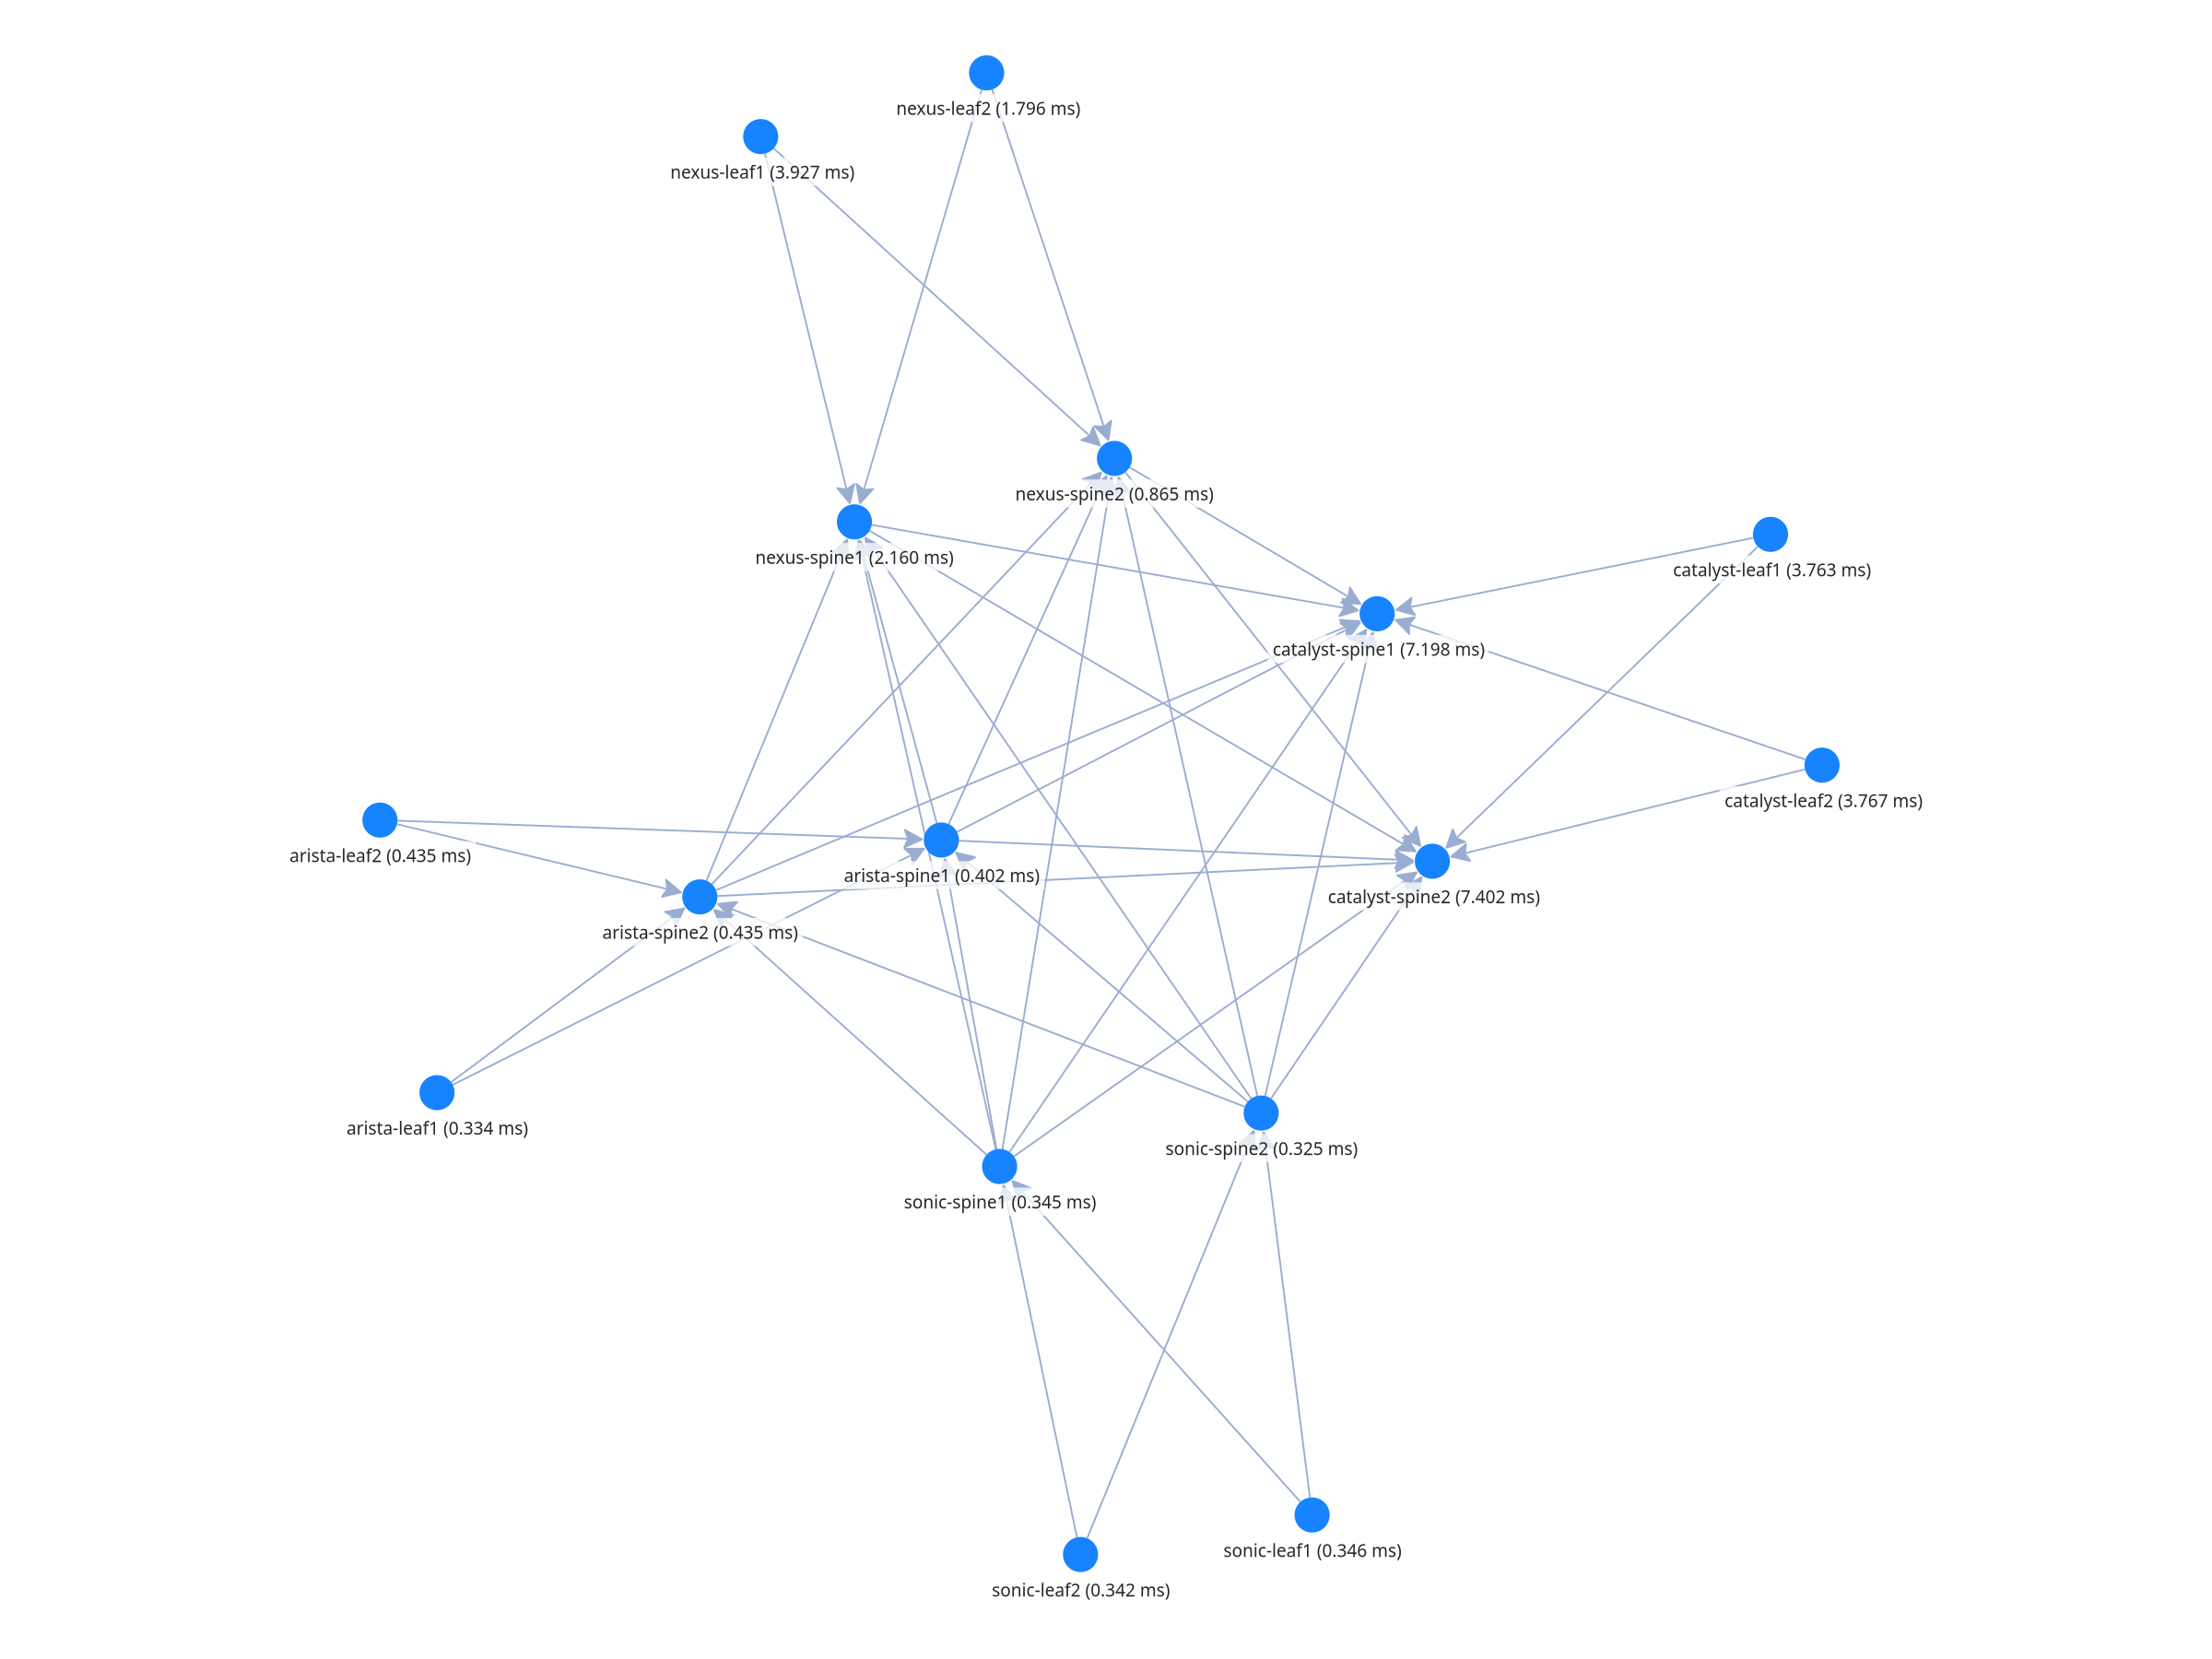
├─ Topology Map → run_full_network_scan
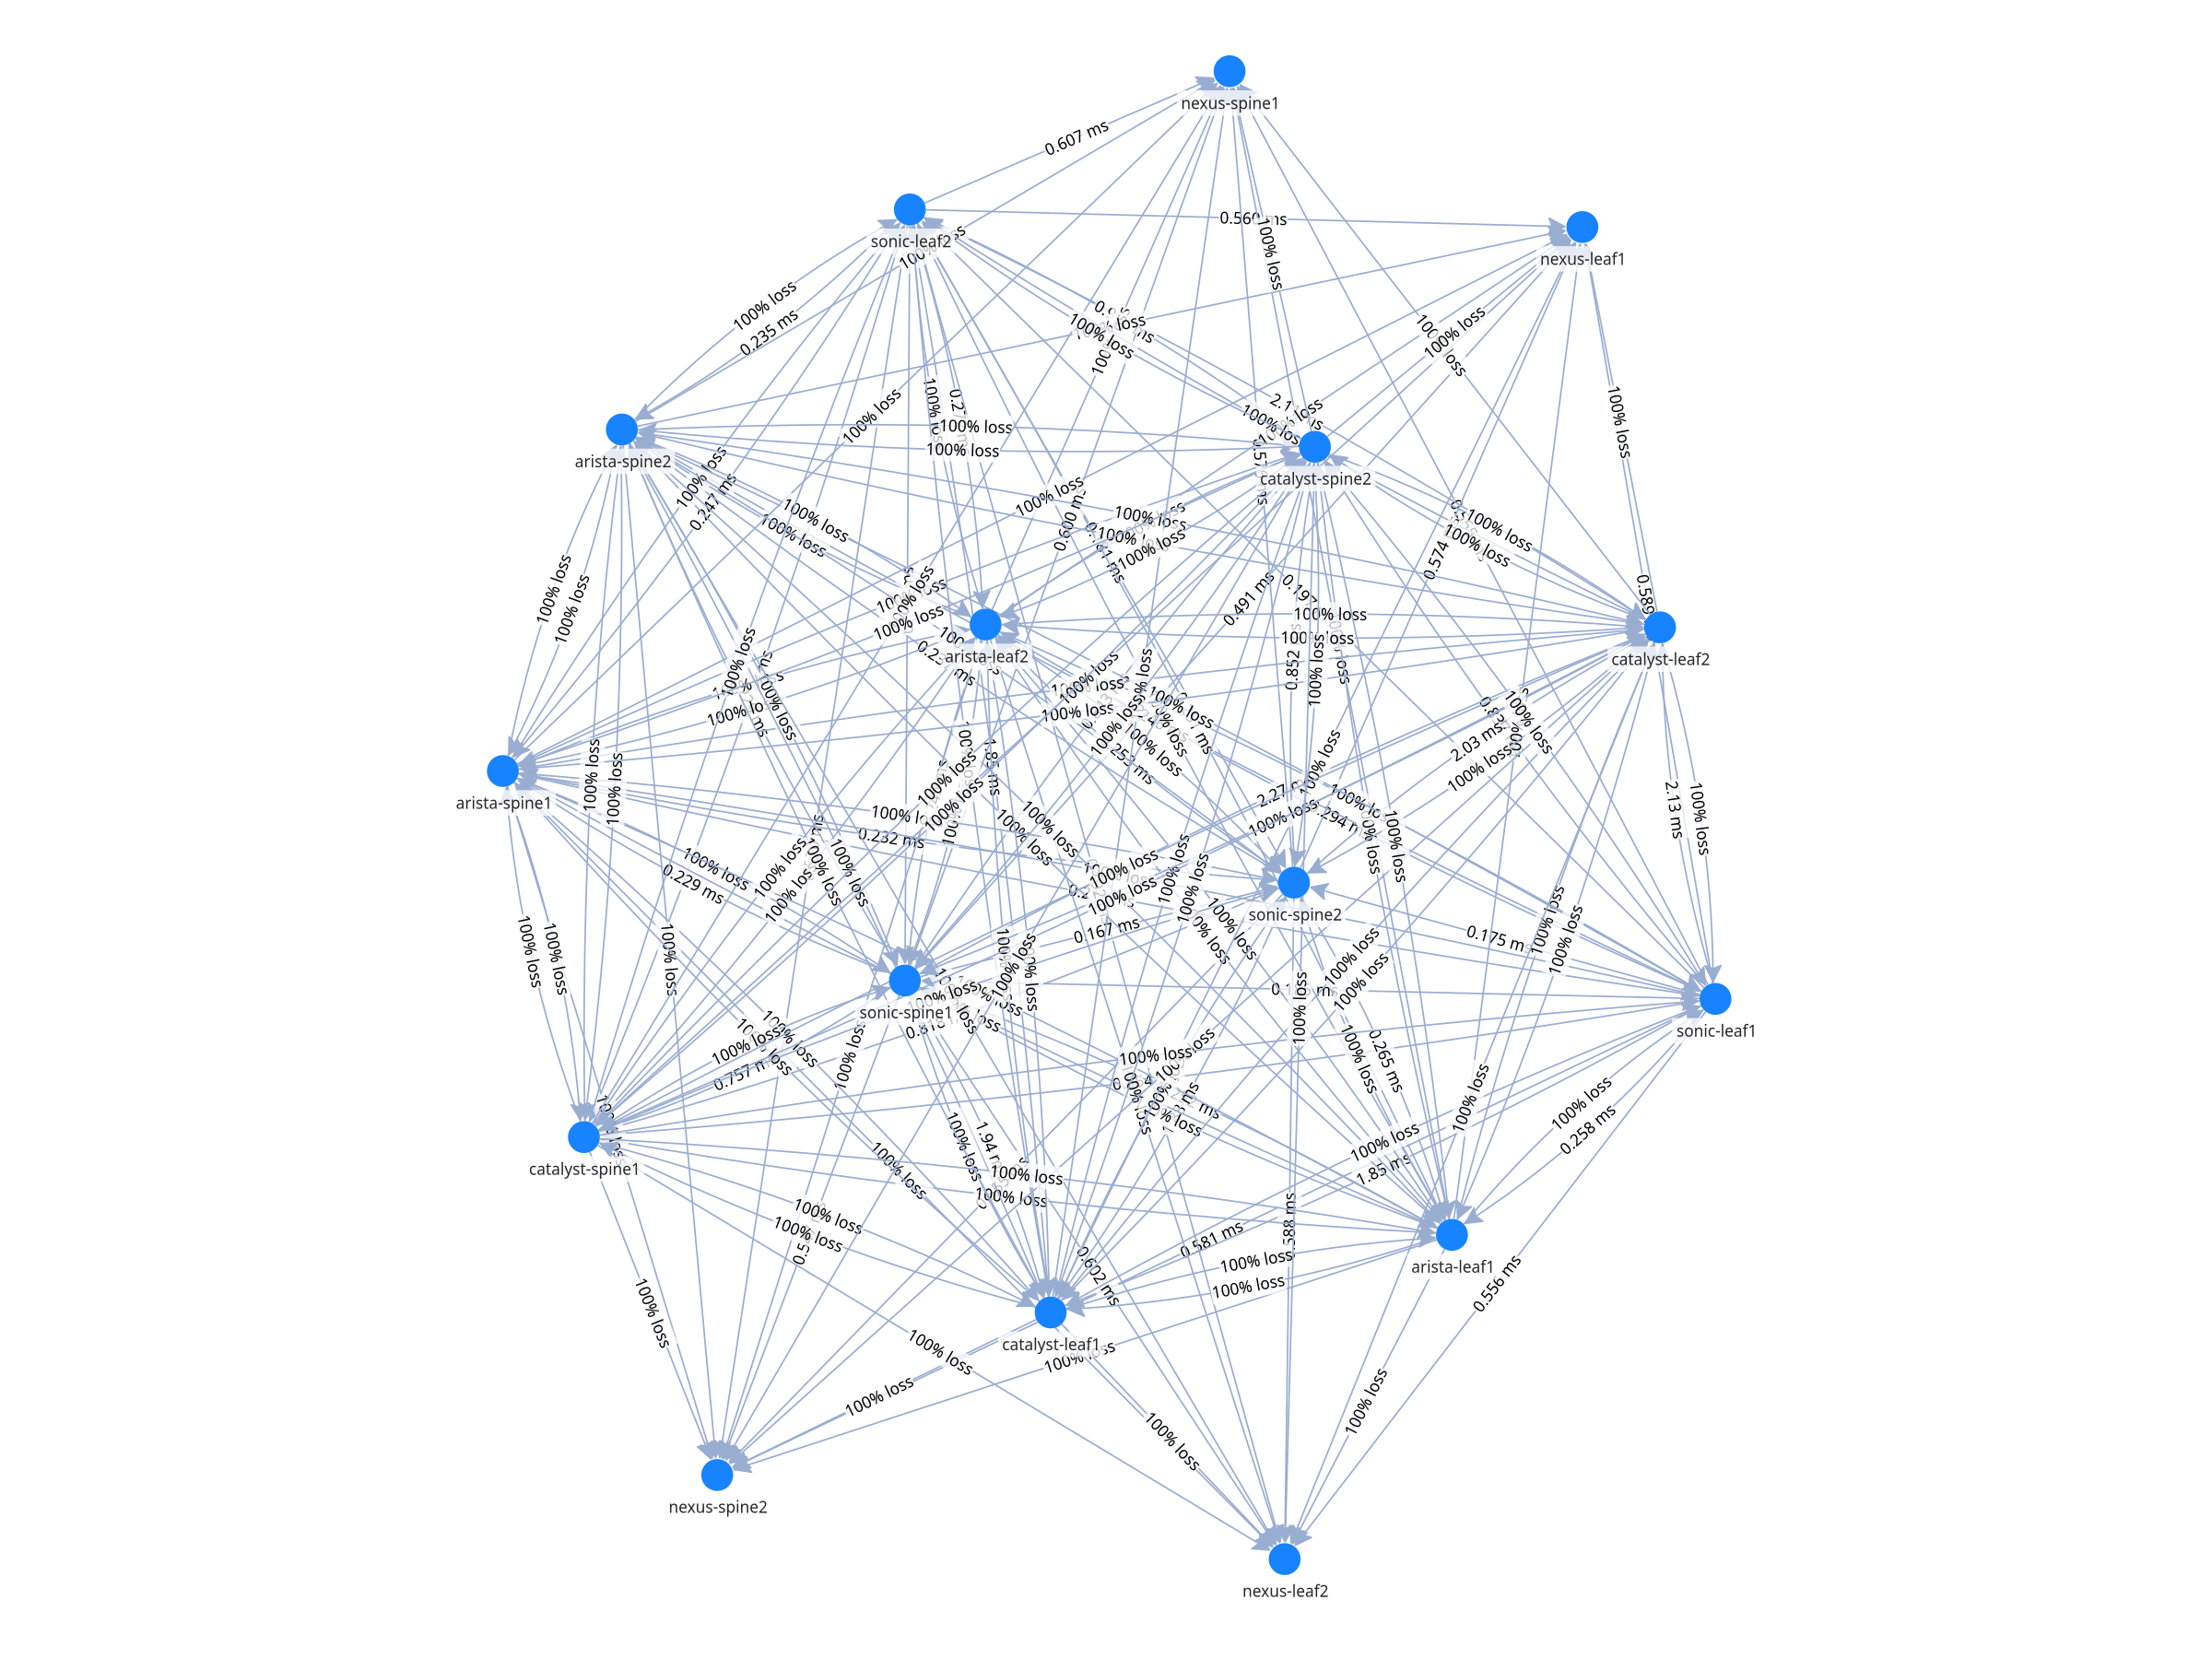
├─ Connectivity Matrix (Heatmap) → run_ping_mesh
├─ Tracing Path via Nodes → run_remote_traceroute
└─ Specific Device Health
├─ Check basic reachability → check_device_health
└─ Diagnose loss/latency → collect_network_data + analyze_path_topology
Streamlit Dashboard Workflow
For real-time graphical rendering of the telemetry, we use a Streamlit-based interface.
- Unified Topology Graph using
pyvis - Fabric Heatmap tracking real-time packet loss and latency
- Remote Traceroute Path Visualization
Configuration (Required)
Verify tools/inventory.py includes accurate device credentials mapping for SSH fallback logic.
SQLite Database relies on:
DB_PATH = "/tmp/netpath_data.db"
Setup & Run Instructions
Clone the Repository
git clone https://github.com/AvizNetworks/ncp-sdk-agents.git
cd ncp-sdk-agents
git checkout netpath-agent
Configure Inventory Credentials
Edit tools/inventory.py and update the DEVICE_REGISTRY with your own nodes:
"192.168.4.11": {"name": "sonic-leaf1", "platform": "linux", "user": "admin", "pass": "aviz@123"},
Authenticate with NCP
Provide the following details when prompted or via config:
- NCP URL
- Username
- Password
Install NCP SDK Package
pip install ncp
For creating package (.ncp)
ncp authenticate
ncp package .
Deploy Agent to NCP Playground
- Deploy the package agent
.ncpncp deploy netpath-agent.ncp --update - Launch NCP CLI UI
ncp playground --agent netpath-agent
Use the NCP UI & Dashboard
This project is deployed in two parts: the Backend logic via the NCP UI, and the Visual Dashboard directly on the host VM.
Part A: Interact via NCP UI
1. Access your NCP platform via web browser (e.g. https://192.168.4.10 or 192.168.4.183).
2. Select the NetPath-Agent from the Chat interface.
3. Ask natural language questions like:
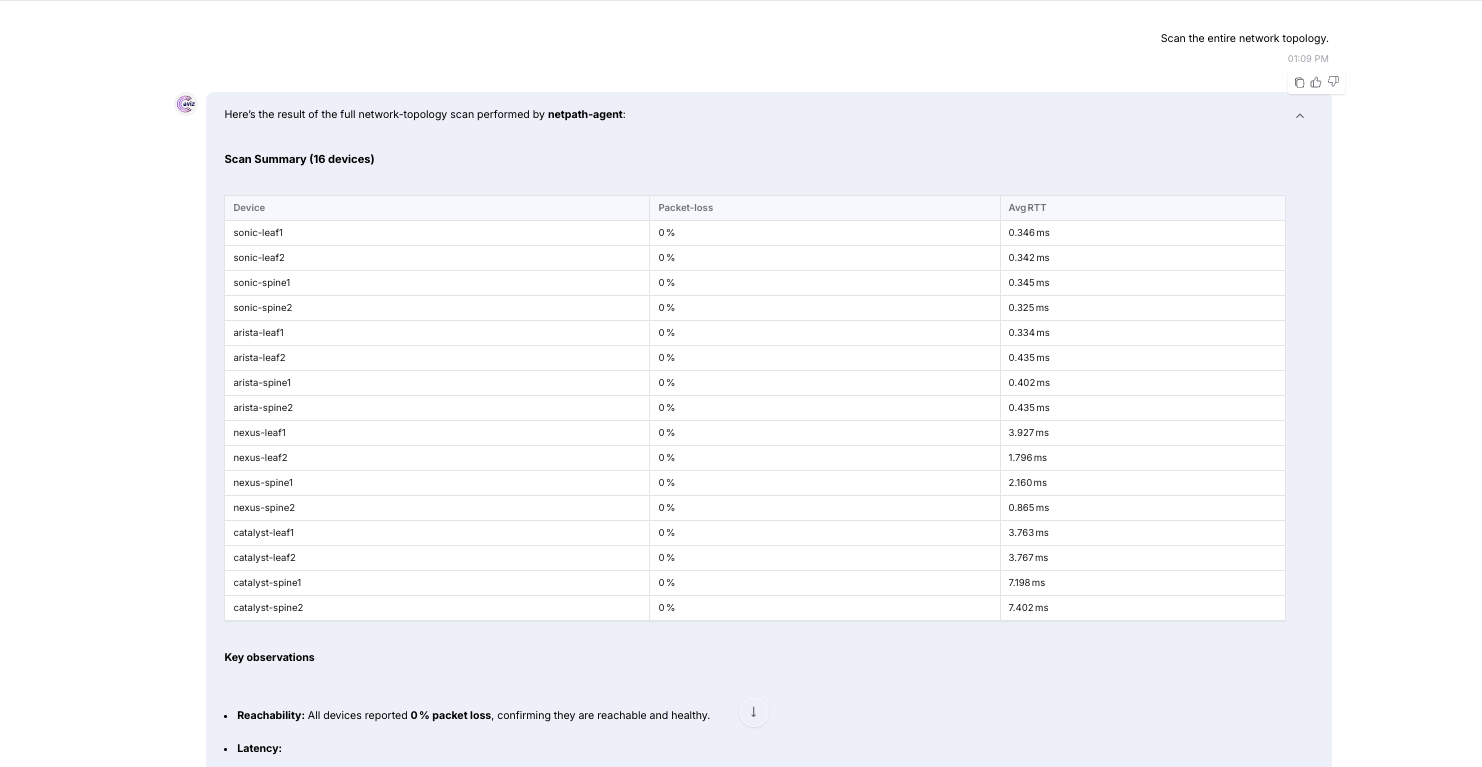
* "Scan the network topology."
* "Run a full ping mesh to build the heatmap."
* "Trace the route from nexus-leaf1 to 8.8.8.8 and show me a bar chart of the hops."
Screenshots
QnA on NCP UI
Ping Mesh Results Visualization
Traceroute Results Visualization
Example Interaction
User:
Trace the route from arista-leaf1 to 8.8.8.8
NetPath_Agent Workflow:
- Resolve Name -> IP using
list_inventory/get_device_details. - Attempt connection using
run_remote_traceroute, identifying device as NX-OS. - Authenticate and perform tracing to
8.8.8.8. - Provide tabular RTTs for each hop.
- Agent informs the user to view the "Traceroute Path Visualization" tab in the Streamlit Dashboard for network visualization.
Future Enhancements
- BGP/OSPF dynamic routing protocol insight scanning
- Streaming telemetry integrations for live alerts
- Direct integrations into broader ONES fabric topologies
Contributors / Maintainers
Devendra