Agent-MO (Memory Observer)
Overview
Agent-MO is an intelligent network diagnostic agent designed to analyze memory utilization, detect memory leaks, and forecast future memory trends across network devices.
It works at device, service, and network levels and supports both standard devices and Cisco Catalyst Center–managed devices. The agent follows a strict, tool-driven workflow to ensure consistent, accurate, and explainable diagnostics.
Key Capabilities
- Real-time memory utilization analysis
-
Memory leak detection [Mann-kendall]
-
Device-level
- Network-level
- Service-level
- Memory forecasting using XGBoost
- Catalyst Center–aware analysis
- Guided troubleshooting recommendations
Agent Definition
agent = Agent(
    name="Agent-MO",
    description="An expert network diagnostic assistant specializing in memory utilization analysis, leak detection and forecasting.",
    instructions=...
)
Agent-MO strictly uses tool-based execution (no manual SQL or assumptions).
Tools Used
Agent-MO is powered by the following tools:
tools = [
    get_device_info,
    get_memory_utilization,
    predict_device_memory_xgboost,
    datastore,
    device_level_memory_leak_analysis,
    network_level_memory_leak_analysis,
    service_level_memory_analysis,
    get_catalyst_center_devices,
    memory_leak_analysis_and_detection_for_catalyst_center_devices,
    get_memory_utilization_for_catalyst_center_devices,
]
Tool Responsibilities
| Tool | Purpose |
|---|---|
get_device_info |
Resolves IP/Hostname → MAC address |
get_memory_utilization |
Current memory snapshot |
service_level_memory_analysis |
Service-specific memory usage |
device_level_memory_leak_analysis |
Leak detection for a single device |
network_level_memory_leak_analysis |
Leak detection across all devices |
predict_device_memory_xgboost |
Memory usage forecasting |
get_catalyst_center_devices |
Fetch Catalyst Center–managed devices |
memory_leak_analysis_and_detection_for_catalyst_center_devices |
Leak detection for Catalyst devices |
get_memory_utilization_for_catalyst_center_devices |
Utilization for Catalyst devices |
datastore |
Troubleshooting guidance |
Operating Rules & Constraints
- Input Normalization:
If a user provides IP or Hostname →
get_device_infomust be called first. - No Manual SQL: All data access happens via tools.
- Units: Memory utilization values are always in Percentage (%).
- Scope Handling: If no device is specified → analysis defaults to Network-Level.
Memory Leak Decision Flow
Is it a Catalyst Center device?
 ├─ YES → get_catalyst_center_devices
 │       → memory_leak_analysis_and_detection_for_catalyst_center_devices
 └─ NO
     ├─ Specific device provided → device_level_memory_leak_analysis
     └─ No device provided → network_level_memory_leak_analysis
Forecasting Workflow
- Uses XGBoost time-series prediction
- Output is always presented in tabular format
- Supports per-device forecasting
Background Workflow
For Capturing below services memory metrics, we use ONES-API explorer
- SWSS
- BGP
- ONES-Agent
- SYNCd
- SNMP
Configuration (Required) for ONES-API Integration
Update the following values inside tools.py:
BASE_URL_ONES = "Your_ONES_SERVER_URL"
USERNAME_ONES = "YOUR_ONES_USERNAME"
PASSWORD_ONES = "YOUR_ONES_PASSWORD"
Setup & Run Instructions
Clone the Repository
git clone https://github.com/AvizNetworks/ncp-sdk-agents.git
cd ncp-sdk-agents
git checkout agent-mo
Configure ONES Credentials
Edit tools.py and update:
BASE_URL_ONES
USERNAME_ONES
PASSWORD_ONES
Authenticate with NCP
Provide the following details when prompted or via config:
- NCP URL
- Username
- Password
Install NCP SDK Package
pip install ncp
For creating package (.ncp)
ncp authenticate
ncp package .
Deploy Agent to NCP Playground
- Open NCP Playground
- Upload
agent_mo.ncp - Deploy the agent to the NCP Server
Use the NCP UI
- Open NCP UI
- Select Agent-MO
-
Ask natural language questions like:
-
“Check memory leaks for 192.168.1.5”
- “Forecast memory usage for this device”
- “Analyze network-wide memory utilization”
- “Any memory leak is observed in the fabric?”
- “How is the memory footprint in the fabric?”
- “Why is
hitting high memory utilization?" - “Top 10 devices with high memory utilization”
- “Did any device start experiencing memory issues?”
Screenshots
Figure 1. Agent-MO Memory Leak Detection
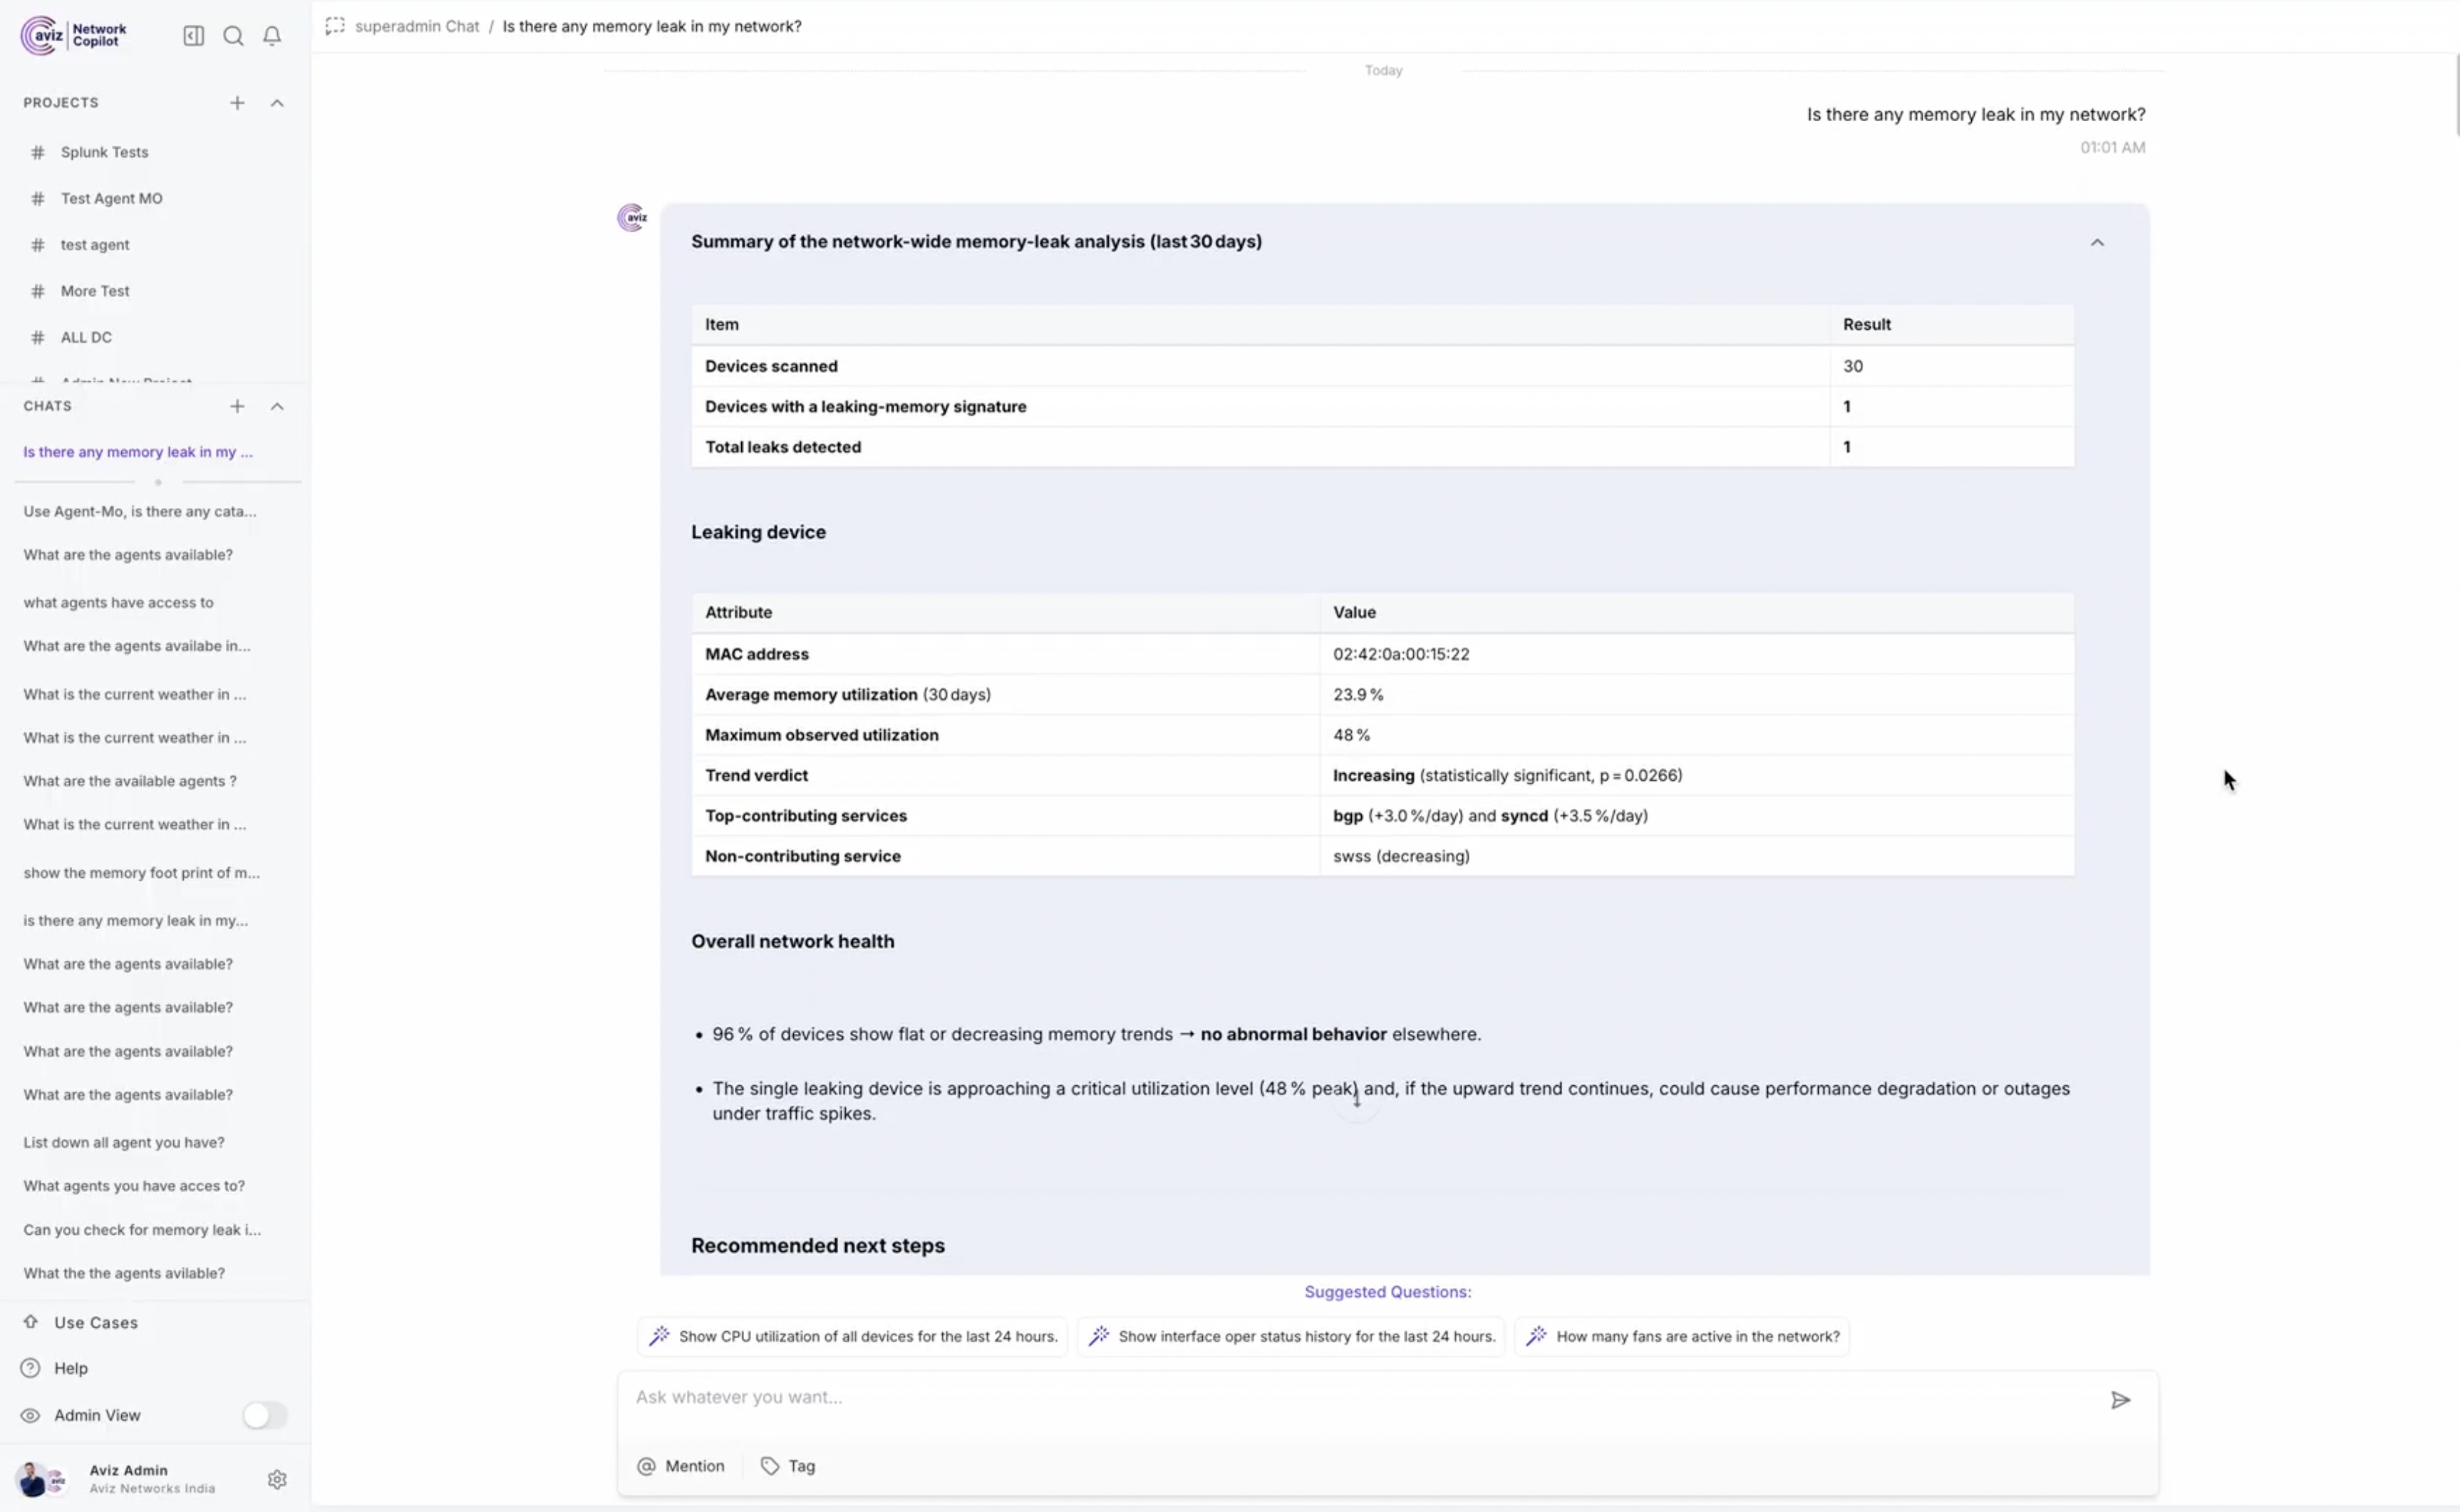
Figure 2. Service-Level Memory Analysis
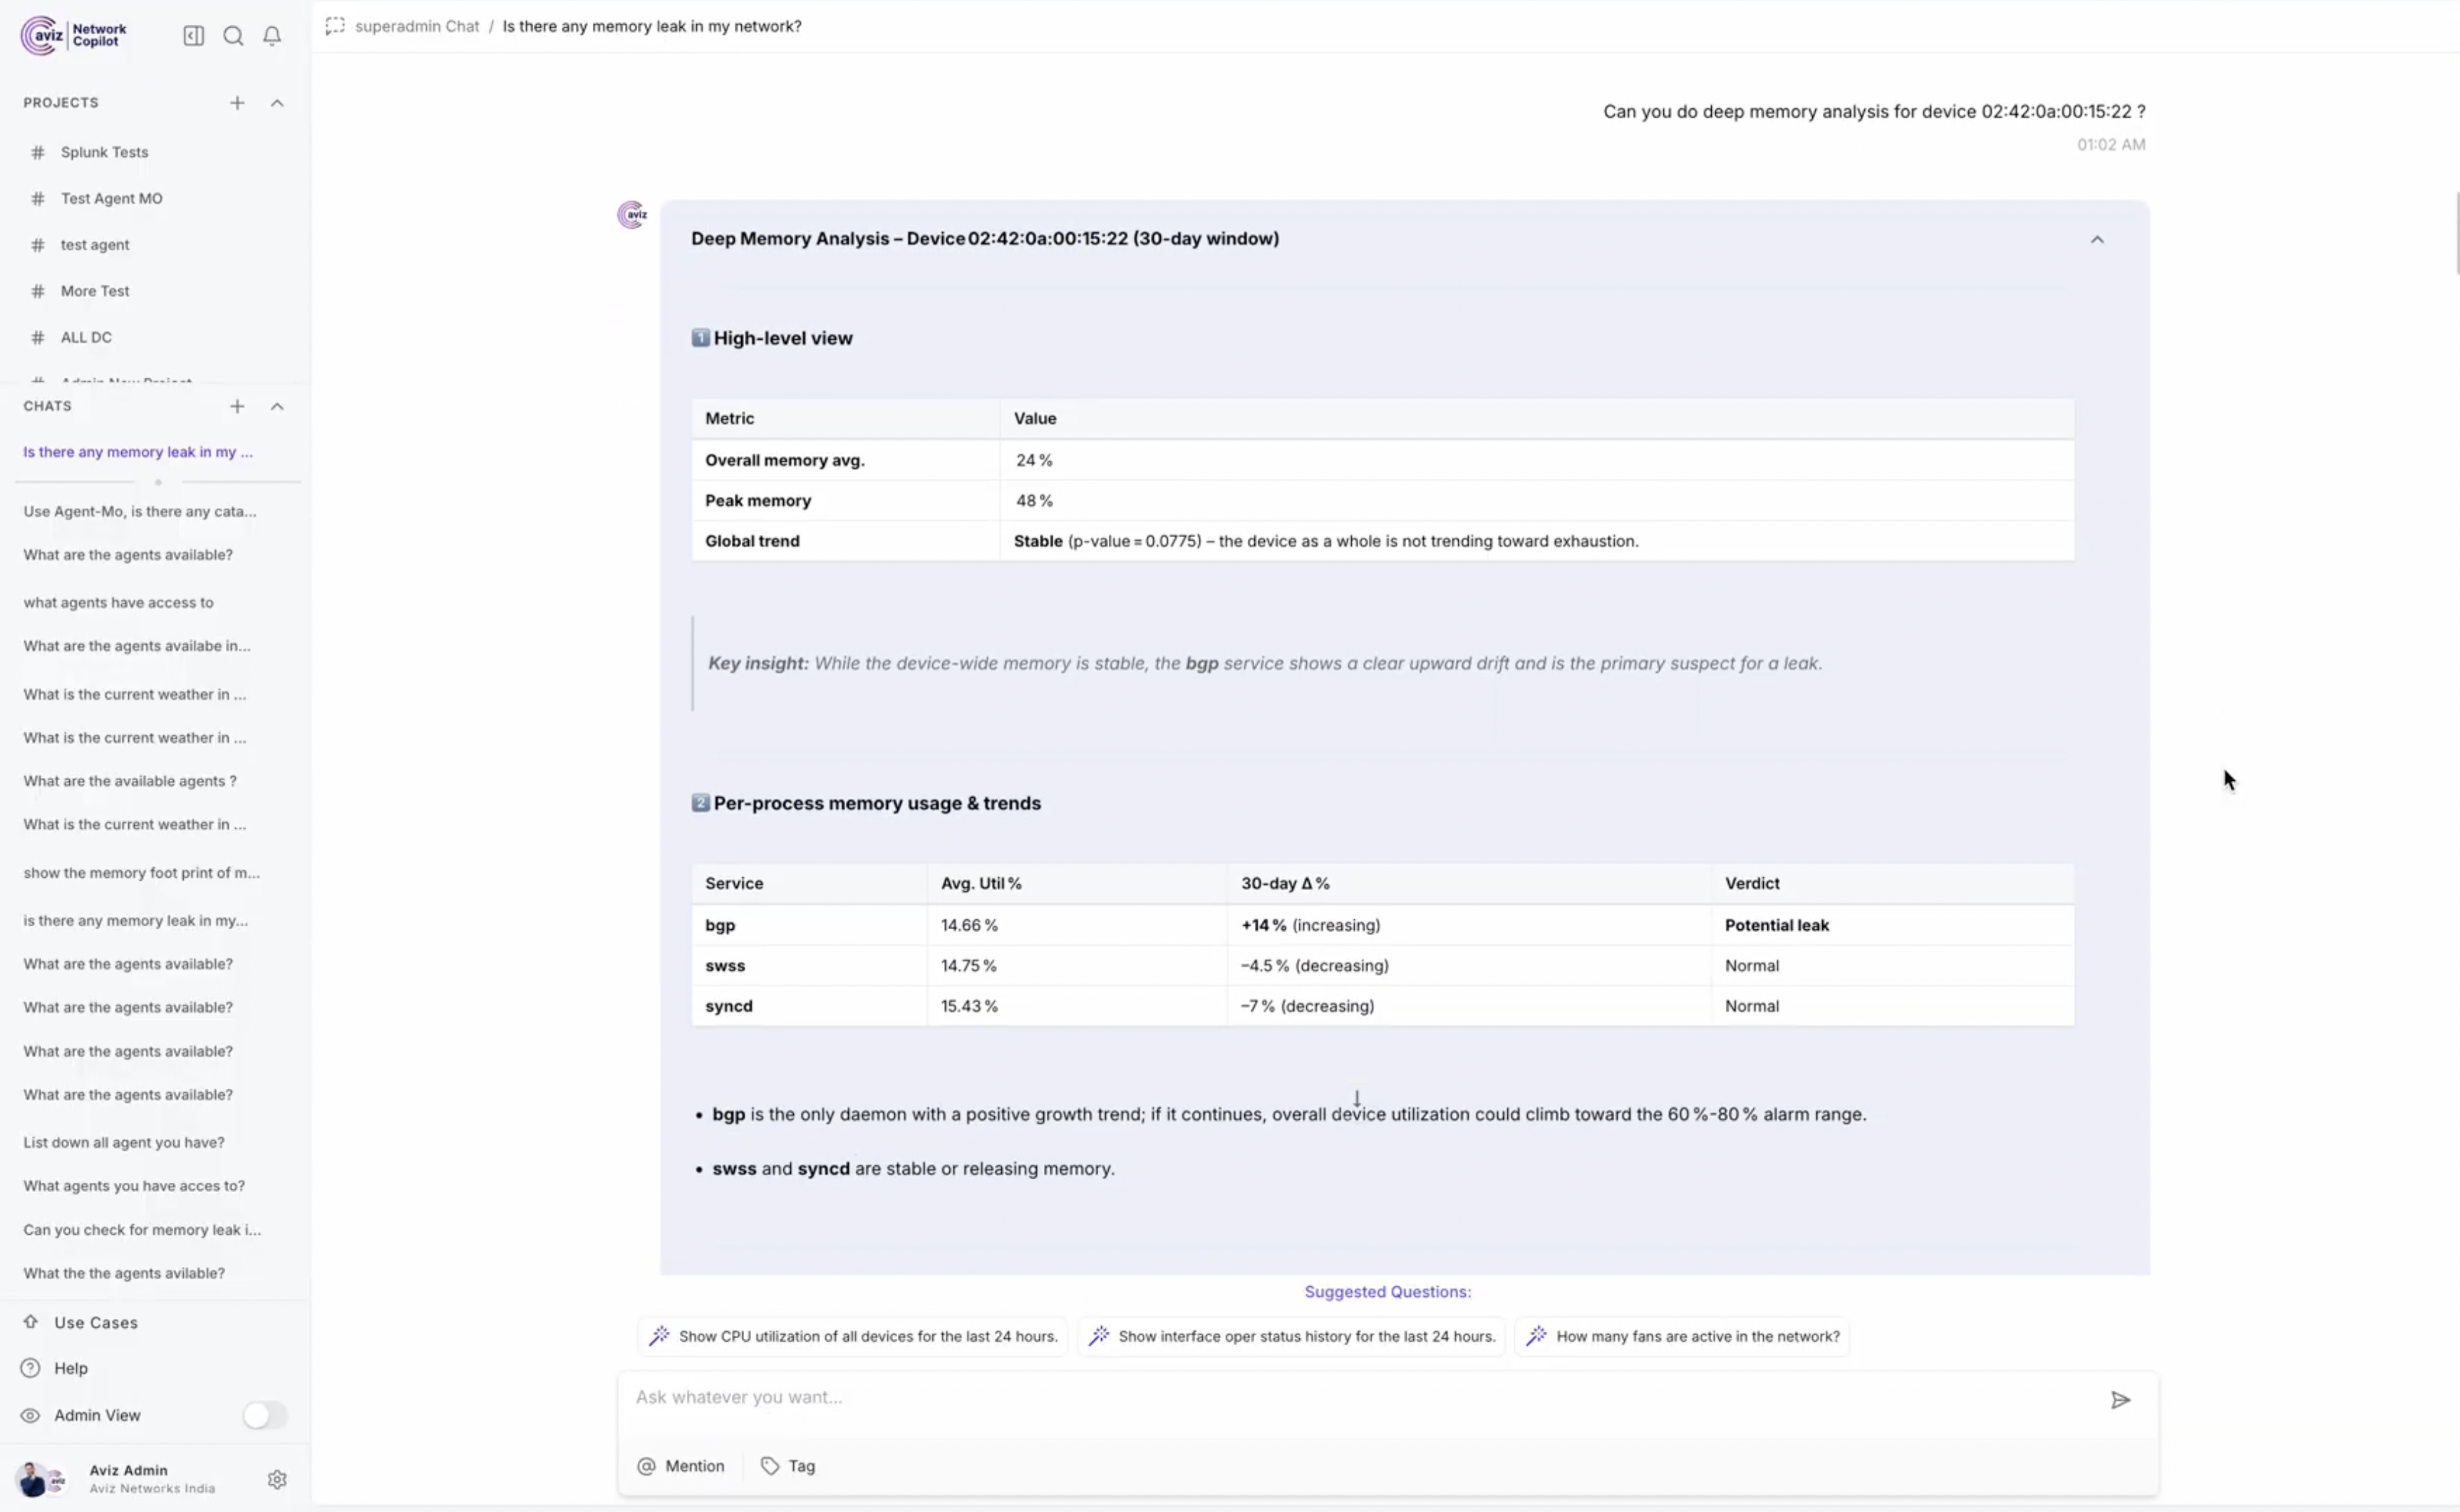
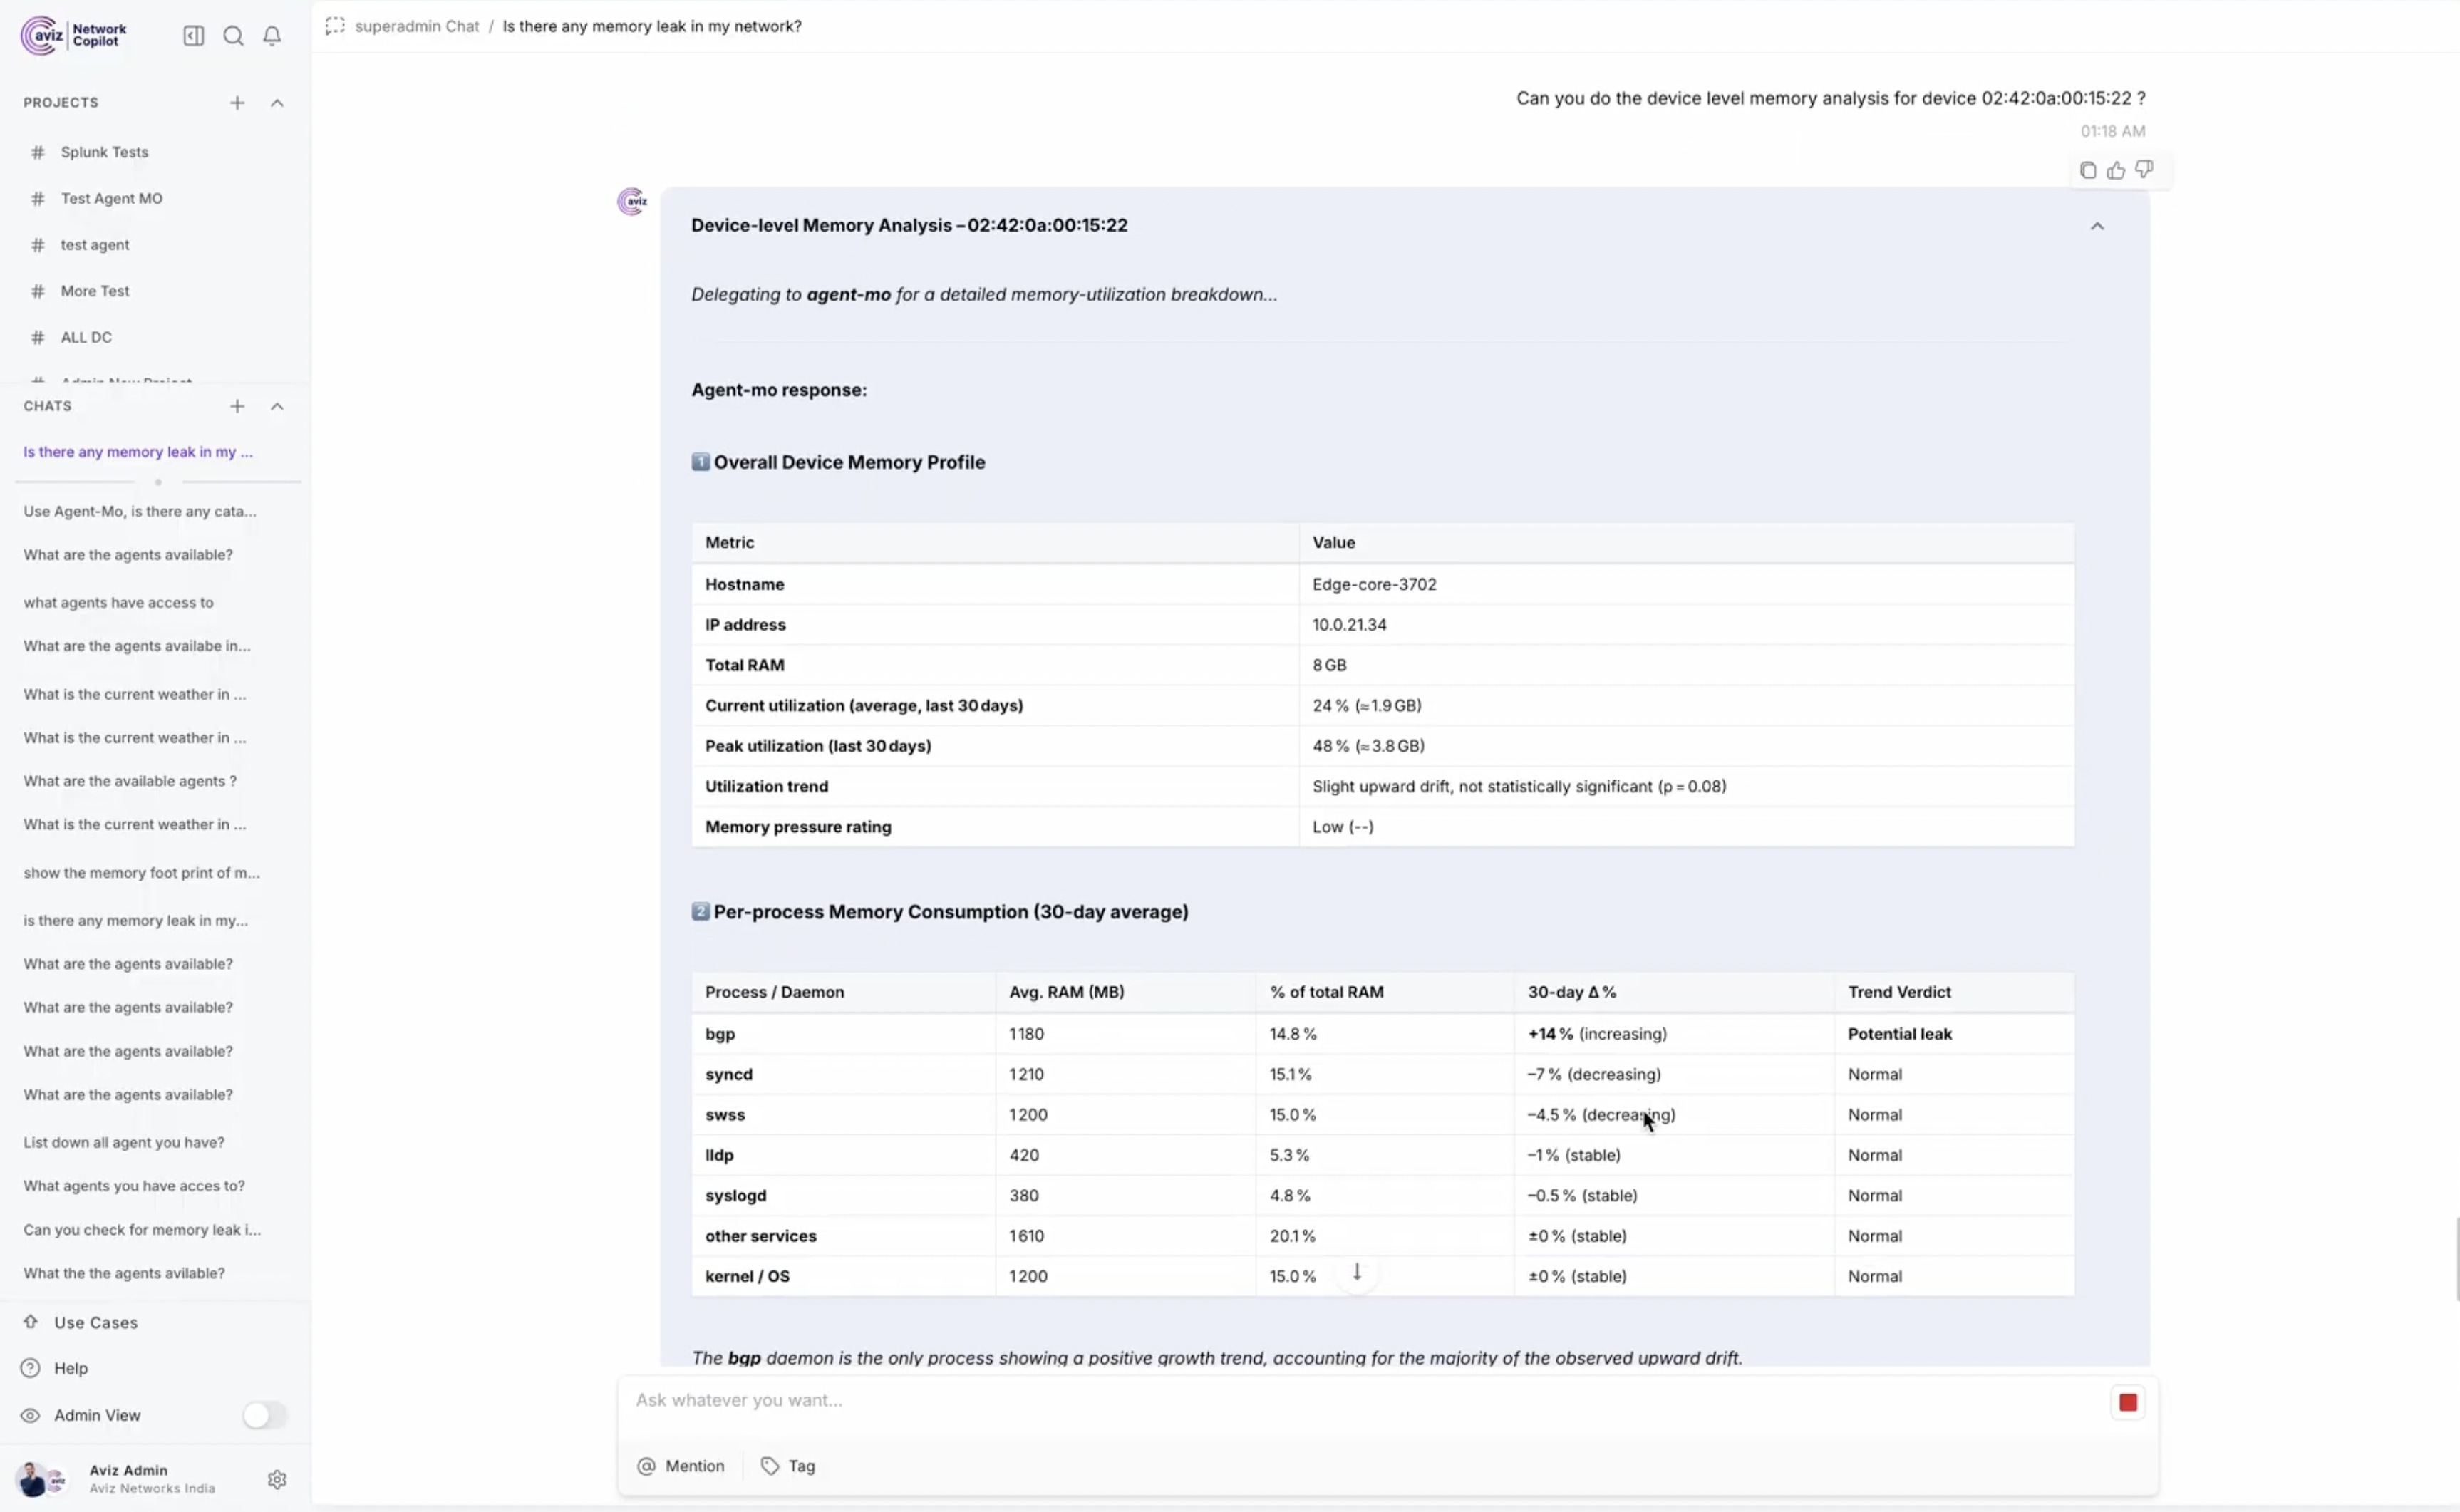
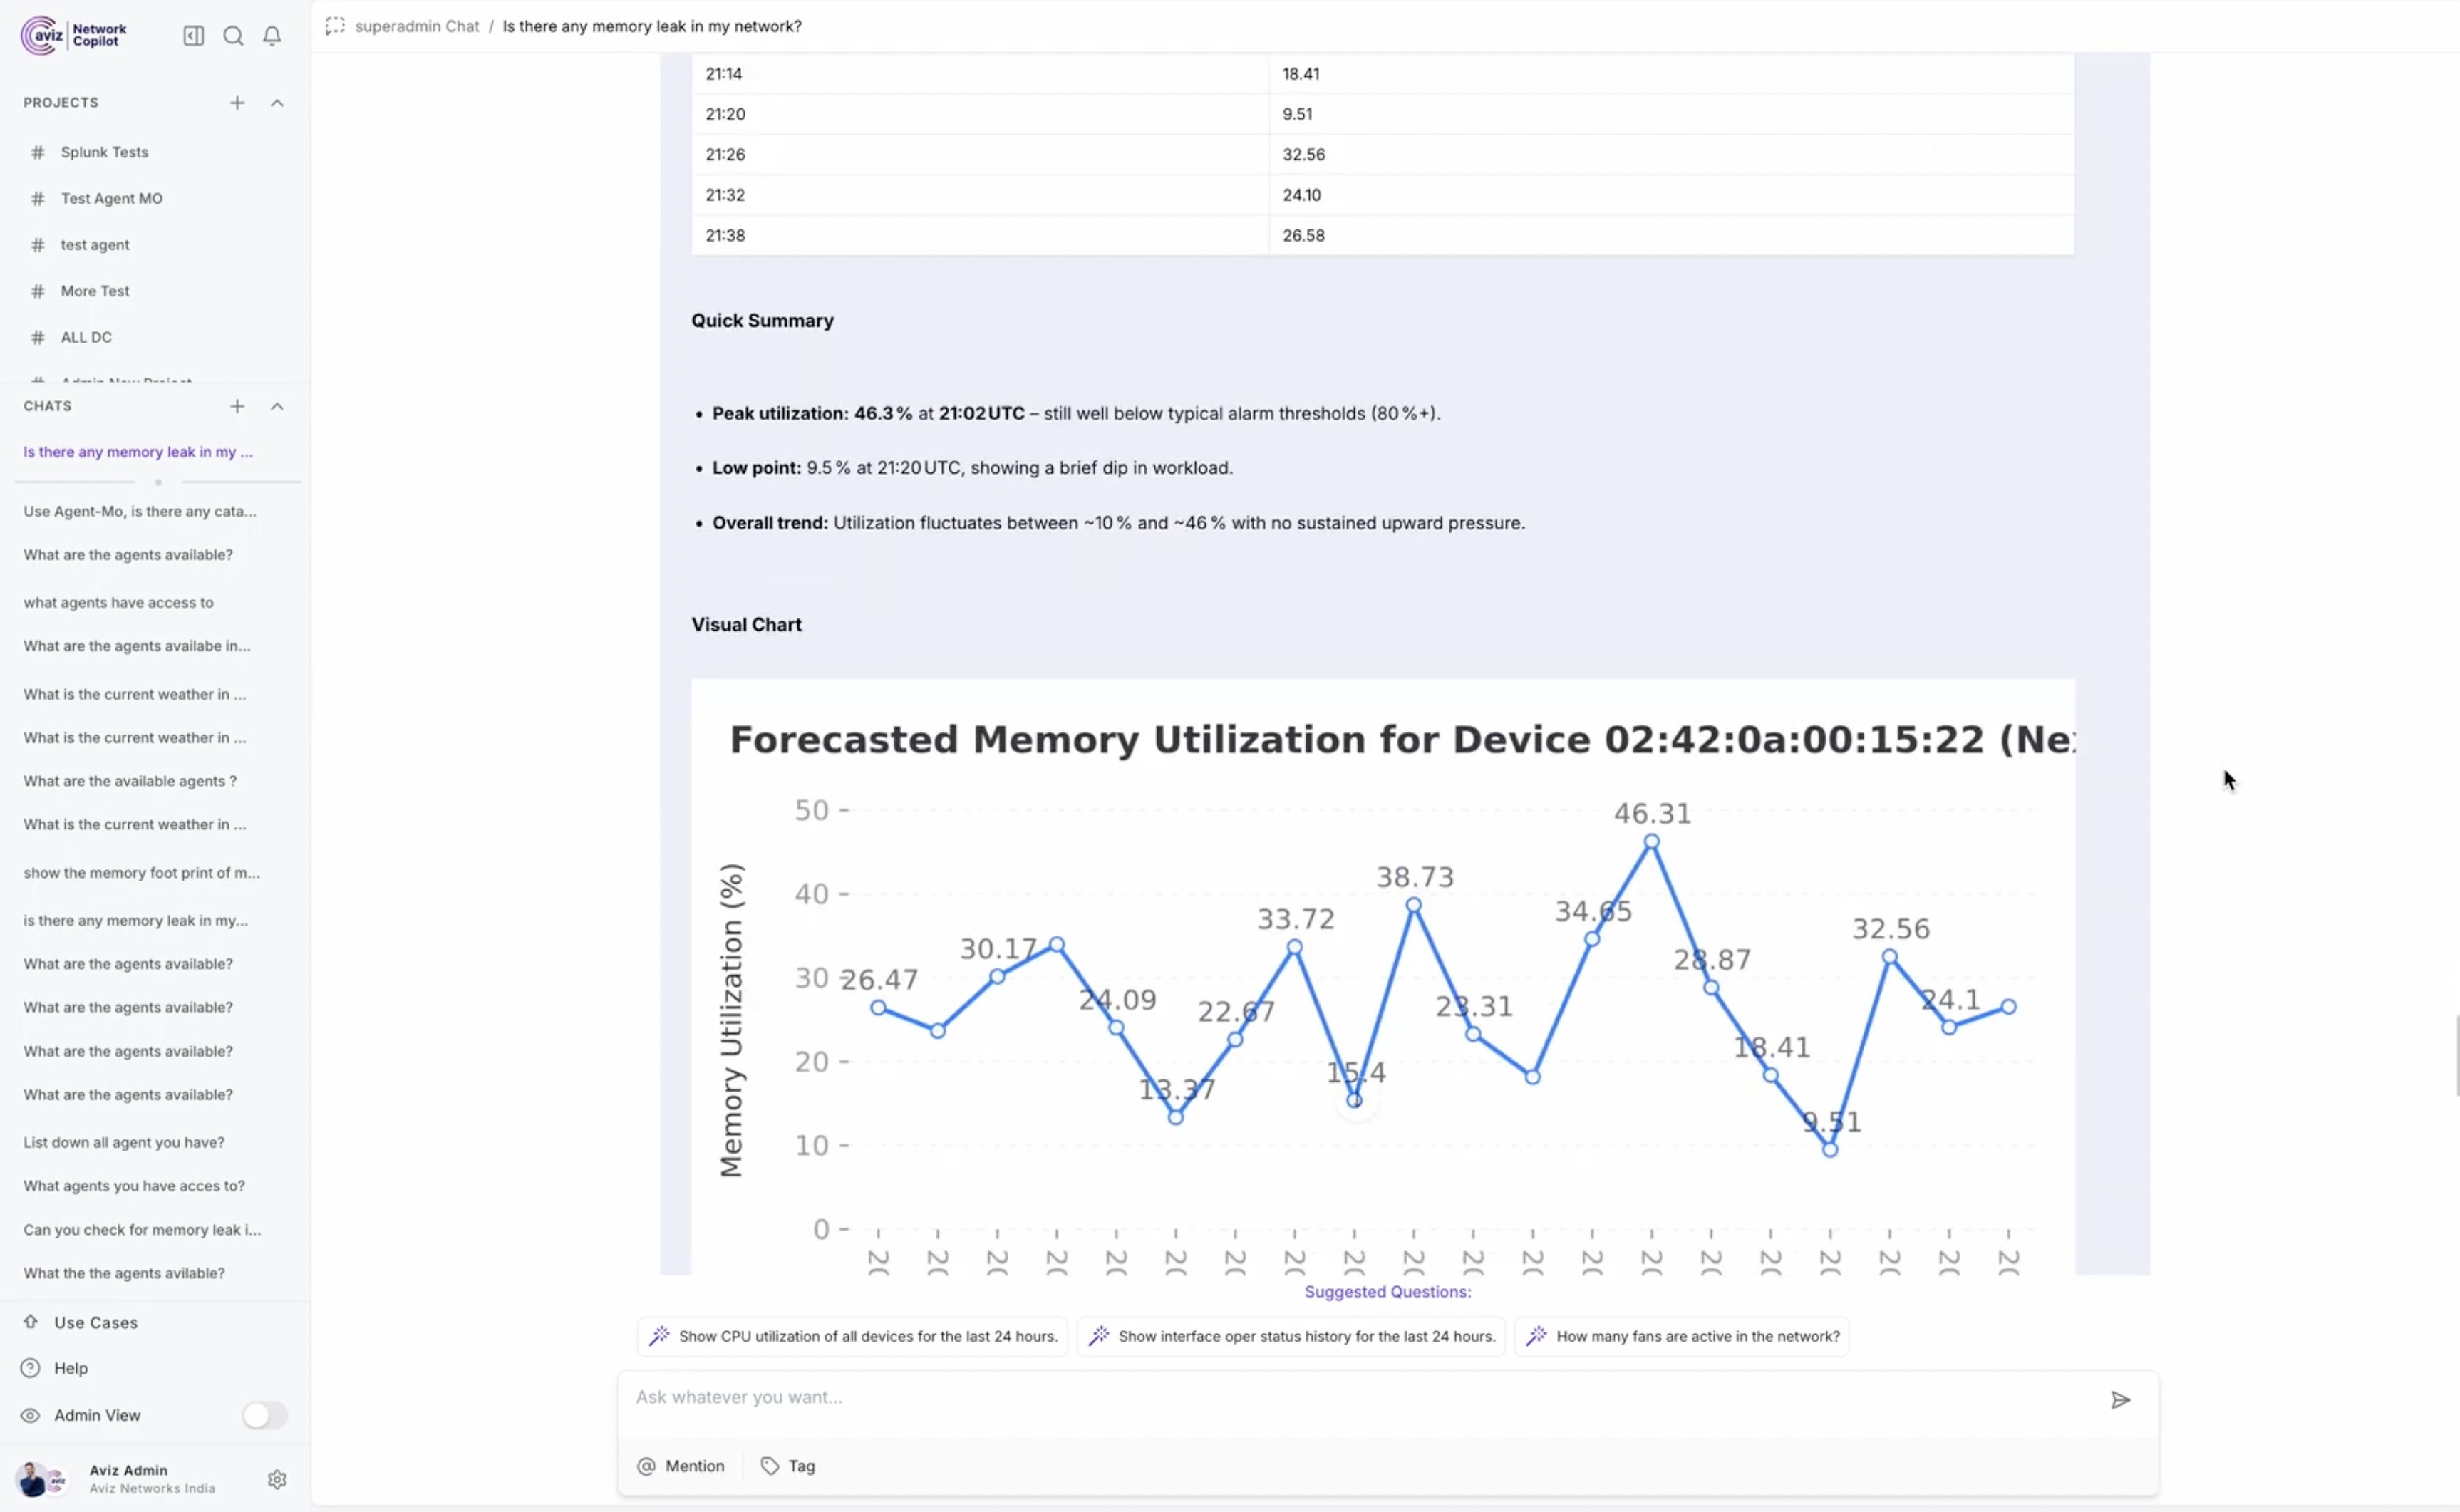
Figure 3. Memory Forecasting Output with Chart
Example Interaction
User:
Check memory leaks for 192.168.1.5
Agent-MO Workflow:
- Resolve IP → MAC using
get_device_info - Detect leak using
device_level_memory_leak_analysis - Present findings with recommendations
Future Enhancements
- Advanced visualization support
- Automated remediation suggestions
- Add supports for Additional dataconnectors like cumulus etc.
- Support for Background agents and automated alerts for potential memory leaks.